Dear all Blog visitors,
When all are bullish Iposted negative divergence chart on Nifty & you all can see heavily selling pressure & volatile sessions pass from many days.
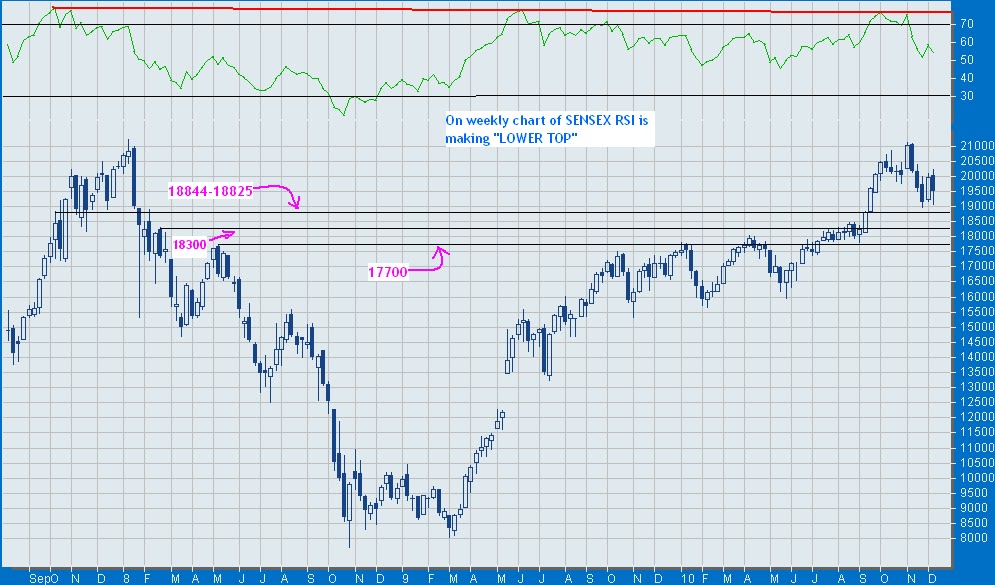
So now decided to give a view on SENSEX by image so you all can understand easily. Click on Image to view a clear chart with levels.
Strong Support levels: 18844-18825, 18300, 17700. If sensex weekly close below 18844 then keep 18300 SL & IF close below 18300 then keep SL 17700. Unfortunately weekly close below 17700 then try to exit from all long positions. Will see SENSEX 16500-15500-13500.
High risk high return trader can buy
- SESA GOA @ 300 Tgt 313-26 SL 287
- SATYAM COMPU. @ 62 tgt 67-71 SL 57.50
Send your valuable views to us on hesh2601@in.com.
He$H. . .

No comments:
Post a Comment